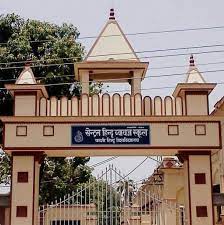
DU Admission 2018 Statistics - The application process of DU started from 15 May and concluded on 7 June 2018. According to the sources, the highest number of applications received this year for admission in Delhi University in UG programme is from CBSE students. More than 2.5 lakhs students have registered this year for admission in Delhi University out of which around 90% applications are of students from CBSE. In comparison to the last year's data, this year the registration has been increased by 21%. Every year around 50% of the applications received are from Delhi. Despite the yearly trend, the government of Delhi, last year had called for a reservation of seats for students who come from Delhi in DU and had given a resolution in the Delhi assembly that 85% of the seats in Delhi government funded colleges should be reserved for the students of Delhi. We the team MOTACHASHMA bring you the DU Admission 2018 Statistics for the year 2018. Only the data of those courses for which the applications have been received over 7,000 is available on this page.
Number of DU Applications received from different boards
- CBSE Students – 2,49,694
- UP Board – 22,266
- Haryana Board – 10,858
- CISCE - 9681

DU Admission 2018 Statistics - General Data
|
Particulars |
Data |
|
Total number of Colleges |
82 |
|
Total number of Seats |
56,000 |
|
Registration received last year |
2,30,000 |
|
Registrations received this year |
2,78,544 |
|
Hike in the percentage of registration |
21% |
|
Merit-based registration |
Around 2,40,000 |
|
Entrance Based registration |
Around 38,500 |
DU Admission 2018 Statistics - Courses and Number of Colleges
|
Courses |
Number of Colleges offering it |
|
Sociology |
9 |
|
Journalism |
11 |
|
Geography |
8 |
|
Psychology |
9 |
|
Mathematics |
21 |
|
Chemistry |
18 |
|
Physics |
21 |
|
English |
45 |
|
Economics |
34 |
|
Political Science |
44 |
|
Hindi |
47 |
|
BCom (H) |
53 |
|
BCom (Pass) |
42 |
|
BA Programme |
52 |
Delhi University Admission 2018 Statistics - No of application received for each course
|
Courses |
Total Applications |
|
Sociology |
75,102 |
|
Journalism |
79,831 |
|
Geography |
75,434 |
|
Psychology |
75,495 |
|
Mathematics |
74,530 |
|
Chemistry |
72,401 |
|
Physics |
70,431 |
|
English |
1,26,327 |
|
Economics |
96,709 |
|
Political Science |
1,05,590 |
|
Hindi |
71,185 |
|
BCom (H) |
74,921 |
|
BCom (Pass) |
85,791 |
|
BA Programme |
1,05,818 |
Seats availability for DU Admission in different courses
|
Courses |
Total Seats |
|
Sociology |
356 |
|
Journalism |
398 |
|
Geography |
417 |
|
Psychology |
429 |
|
Mathematics |
926 |
|
Chemistry |
934 |
|
Physics |
1,151 |
|
English |
2,284 |
|
Economics |
1,982 |
|
Political Science |
2,900 |
|
Hindi |
2,415 |
|
BCom (H) |
6,276 |
|
BCom (Pass) |
6,947 |
|
BA Programme |
10,536 |
DU Admission Statistics 2018 - Applications received per seat
|
Courses |
Applications per seat |
|
Sociology |
210 |
|
Journalism |
201 |
|
Geography |
181 |
|
Psychology |
176 |
|
Mathematics |
81 |
|
Chemistry |
78 |
|
Physics |
61 |
|
English |
55 |
|
Economics |
49 |
|
Political Science |
37 |
|
Hindi |
29 |
|
BCom (H) |
12 |
|
BCom (Pass) |
12 |
|
BA Programme |
10 |
Quick Links
- List of Colleges for DU admission
- Documents to be brought at the time of DU admission
- DU Seats
- DU Reservation of Seats
- DU Sports/ ECA quota admission
In case of any query regarding the DU Admission 2018 Statistics, you can write to us in the comment section below.


